<--- Back to Details
First PageDocument Content
Economy / Economics / Angus Maddison / Gross domestic product / Economic growth / The Conference Board / Output gap / World economy / BRIC / The World Economy: Historical Statistics
Date: 2013-02-15 08:58:14
Economy
Economics
Angus Maddison
Gross domestic product
Economic growth
The Conference Board
Output gap
World economy
BRIC
The World Economy: Historical Statistics

Presented by Bart van Ark, Chief Economist How Unique are Current Times? Global Growth and Crises in Historical Perspective November, 2010
Add to Reading List

Source URL: www.ggdc.net

Download Document from Source Website

File Size: 1,37 MB

Share Document on Facebook

Similar Documents

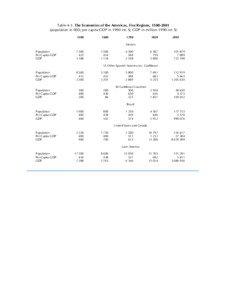
The World Economy: Historical Statistics  Table 4-1. The Economies of the Americas, Five Regions, population in 000; per capita GDP in 1990 int. $; GDP in million 1990 int. $) 1500

The World Economy: Historical Statistics Table 4-1. The Economies of the Americas, Five Regions, population in 000; per capita GDP in 1990 int. $; GDP in million 1990 int. $) 1500

DocID: 1tVWl - View Document

Presented by Bart van Ark, Chief Economist How Unique are Current Times? Global Growth and Crises in Historical Perspective November, 2010

Presented by Bart van Ark, Chief Economist How Unique are Current Times? Global Growth and Crises in Historical Perspective November, 2010

DocID: 1nbwd - View Document

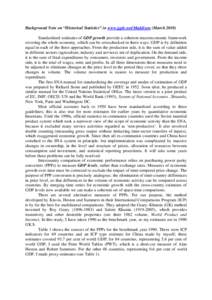
Background Note on “Historical Statistics” in www.ggdc.net/Maddison (MarchStandardized estimates of GDP growth provide a coherent macroeconomic framework covering the whole economy, which can be crosschecked i

Background Note on “Historical Statistics” in www.ggdc.net/Maddison (MarchStandardized estimates of GDP growth provide a coherent macroeconomic framework covering the whole economy, which can be crosschecked i

DocID: 1g3aF - View Document

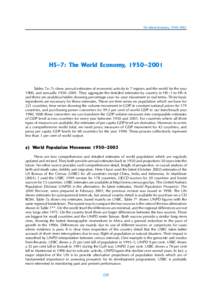
The World Economy, 1950–2001  HS–7: The World Economy, 1950–2001 Tables 7a–7c show annual estimates of economic activity in 7 regions and the world for the year 1900, and annually 1950–2001. They aggregate the

The World Economy, 1950–2001 HS–7: The World Economy, 1950–2001 Tables 7a–7c show annual estimates of economic activity in 7 regions and the world for the year 1900, and annually 1950–2001. They aggregate the

DocID: 1fT6X - View Document

The World Economy, AD  HS–8: The World Economy, 1–2001 AD Tables HS–8 show levels of population, GDP and per capita GDP in 20 countries, 7 regions and the world for eight benchmark years in the past two mill

The World Economy, AD HS–8: The World Economy, 1–2001 AD Tables HS–8 show levels of population, GDP and per capita GDP in 20 countries, 7 regions and the world for eight benchmark years in the past two mill

DocID: 1fSPL - View Document