Toggle navigation
PDFSEARCH.IO
Document Search Engine - browse more than 18 million documents
Sign up
Sign in
Back to Results
First Page
Meta Content
View Document Preview and Link
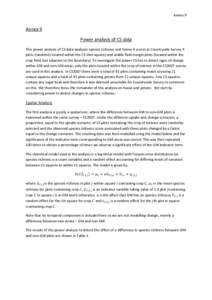
Annex 9 Annex 9 Power analysis of CS data This power analysis of CS data analyses species richness and Grime R scores in Countryside Survey X plots (randomly located within the CS 1km square) and arable field margin plo
Add to Reading List
Document Date: 2014-11-07 06:00:54
Open Document
File Size: 497,73 KB
Share Result on Facebook
 Annex 9 Annex 9 Power analysis of CS data This power analysis of CS data analyses species richness and Grime R scores in Countryside Survey X plots (randomly located within the CS 1km square) and arable field margin plo