<--- Back to Details
First PageDocument Content
National accounts / Macroeconomics / Economic growth / Net present value / Gross domestic product / Hindu rate of growth / Penn World Table / Economics / Economic indicators / Welfare economics
Date: 2014-03-24 16:25:22
National accounts
Macroeconomics
Economic growth
Net present value
Gross domestic product
Hindu rate of growth
Penn World Table
Economics
Economic indicators
Welfare economics

Trillions Gained and Lost: Estimating the Magnitude of Growth Episodes Lant Pritchett, Kunal Sen, Sabyasachi Kar, Selim Raihan CID Working Paper No. 279
Add to Reading List

Source URL: www.hks.harvard.edu

Download Document from Source Website

File Size: 3,58 MB

Share Document on Facebook

Similar Documents

JUNE 4, 2018  Labor market going strong Economic reports ranging from gross domestic product to manufacturing to consumer confidence released last week were solid. Not spectacular, but certainly in line with the view tha

JUNE 4, 2018 Labor market going strong Economic reports ranging from gross domestic product to manufacturing to consumer confidence released last week were solid. Not spectacular, but certainly in line with the view tha

DocID: 1vdo3 - View Document

National AccountsQuarterly national accounts 2018, 1st quarter  Gross domestic product grew by 1.2 per cent from the

National AccountsQuarterly national accounts 2018, 1st quarter Gross domestic product grew by 1.2 per cent from the

DocID: 1v2JZ - View Document

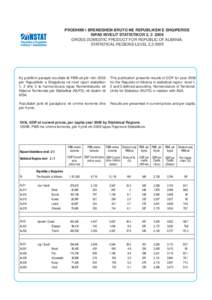
PRODHIMI I BRENDSHEM BRUTO NE REPUBLIKEN E SHQIPERISE SIPAS NIVELIT STATISTIKOR 2, GROSS DOMESTIC PRODUCT FOR REPUBLIC OF ALBANIA, STATISTICAL REGIONS LEVEL 2,Ky publikim paraqet rezultate të PBB-së për

PRODHIMI I BRENDSHEM BRUTO NE REPUBLIKEN E SHQIPERISE SIPAS NIVELIT STATISTIKOR 2, GROSS DOMESTIC PRODUCT FOR REPUBLIC OF ALBANIA, STATISTICAL REGIONS LEVEL 2,Ky publikim paraqet rezultate të PBB-së për

DocID: 1uy90 - View Document

Military expenditure by country as percentage of gross domestic product, see below for) © SIPRI 2018 Countries are grouped by region and subregion Figures in blue are SIPRI estimates. Figures in red

Military expenditure by country as percentage of gross domestic product, see below for) © SIPRI 2018 Countries are grouped by region and subregion Figures in blue are SIPRI estimates. Figures in red

DocID: 1uqSj - View Document

Papua New Guinea NATIONAL ACCOUNTSGROSS DOMESTIC PRODUCT AT CURRENT AND CONTSTANT PRICES  INDUSTRY SHARE OF GROSS VALUE

Papua New Guinea NATIONAL ACCOUNTSGROSS DOMESTIC PRODUCT AT CURRENT AND CONTSTANT PRICES INDUSTRY SHARE OF GROSS VALUE

DocID: 1ugdb - View Document