 Date: 2017-09-27 13:52:34
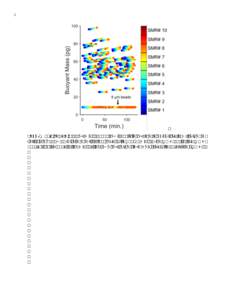
| |  Supplementary Figure 1 Cell mass (L1210 hematopoietic cell line) is calculated from frequency shifts using 8 µm polystyrene calibration beads with known mass. Blue (SMR #1) to red (SMR #10) dots correspond to the mass o Supplementary Figure 1 Cell mass (L1210 hematopoietic cell line) is calculated from frequency shifts using 8 µm polystyrene calibration beads with known mass. Blue (SMR #1) to red (SMR #10) dots correspond to the mass o
Add to Reading ListSource URL: manalis-lab.mit.eduDownload Document from Source Website File Size: 3,06 MBShare Document on Facebook
|