Toggle navigation
PDFSEARCH.IO
Document Search Engine - browse more than 18 million documents
Sign up
Sign in
<--- Back to Details
First Page
Document Content
Date: 2016-11-15 16:50:03
Fig. 2. Dot density plot of cattle on feed.
Add to Reading List
Source URL: ucanr.edu
Download Document from Source Website
File Size: 1,40 MB
Share Document on Facebook
Similar Documents
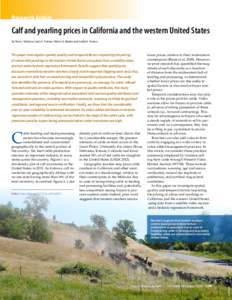
 Fig. 2. Dot density plot of cattle on feed.