 Date: 2015-09-07 07:00:53
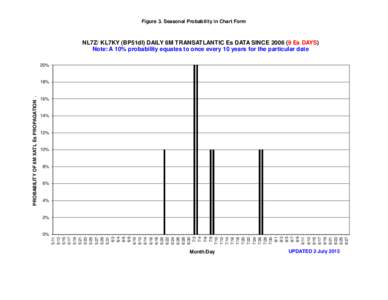
| |  Figure 3. Seasonal Probability in Chart Form NL7Z/ KL7KY (BP51dl) DAILY 6M TRANSATLANTIC Es DATA SINCEEs DAYS) Note: A 10% probability equates to once every 10 years for the particular date 20% Figure 3. Seasonal Probability in Chart Form NL7Z/ KL7KY (BP51dl) DAILY 6M TRANSATLANTIC Es DATA SINCEEs DAYS) Note: A 10% probability equates to once every 10 years for the particular date 20%
Add to Reading ListSource URL: www.k1six.comDownload Document from Source Website File Size: 14,83 KBShare Document on Facebook
|