<--- Back to Details
First PageDocument Content
Logarithms / Mathematical series / Complex analysis / Pi / Inverse trigonometric functions / Analytic number theory / Mathematical fallacy / Natural logarithm / Series / Mathematics / Mathematical analysis / Special functions
Date: 2002-04-16 17:30:02
Logarithms
Mathematical series
Complex analysis
Pi
Inverse trigonometric functions
Analytic number theory
Mathematical fallacy
Natural logarithm
Series
Mathematics
Mathematical analysis
Special functions

UIUC UNDERGRADUATE MATH CONTEST APRIL 13, 2002, 10 am – 1 pm SOLUTIONS Problem 1 Without any numerical calculations, determine which of the two numbers eπ and π e is larger.
Add to Reading List

Source URL: www.math.illinois.edu

Download Document from Source Website

File Size: 72,74 KB

Share Document on Facebook

Similar Documents

List of Publications Ofer Arieli Books 1. A.Avron, O.Arieli. A.Zamansky. Theory of Effective Propositional Paraconsistent Logics. Studies in Logic, volume 75 (sub-series: Mathematical Logic and Foundations), College Publ

List of Publications Ofer Arieli Books 1. A.Avron, O.Arieli. A.Zamansky. Theory of Effective Propositional Paraconsistent Logics. Studies in Logic, volume 75 (sub-series: Mathematical Logic and Foundations), College Publ

DocID: 1v75y - View Document

Trends in Mathematics - New Series Information Center for Mathematical Sciences Volume 14, Number 1, 2012, pages 1–29 LECTURES ON EQUIVARIANT SCHUBERT CALCULUS, GKM THEORY AND POSET PINBALL

Trends in Mathematics - New Series Information Center for Mathematical Sciences Volume 14, Number 1, 2012, pages 1–29 LECTURES ON EQUIVARIANT SCHUBERT CALCULUS, GKM THEORY AND POSET PINBALL

DocID: 1ulex - View Document

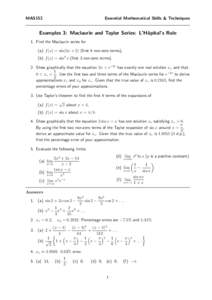
MAS152  Essential Mathematical Skills & Techniques Examples 3: Maclaurin and Taylor Series: L’Hˆ opital’s Rule

MAS152 Essential Mathematical Skills & Techniques Examples 3: Maclaurin and Taylor Series: L’Hˆ opital’s Rule

DocID: 1tLAN - View Document

4  Graphics Drawing a function of one or two variables, or a series of data, makes it easier to grasp a mathematical or physical phenomenon, and helps us make conjectures. In this chapter, we illustrate the graphical cap

4 Graphics Drawing a function of one or two variables, or a series of data, makes it easier to grasp a mathematical or physical phenomenon, and helps us make conjectures. In this chapter, we illustrate the graphical cap

DocID: 1tCEZ - View Document

BULLETIN (New Series) OF THE AMERICAN MATHEMATICAL SOCIETY Volume 43, Number 1, Pages 89–91 SArticle electronically published on November 22, 2005

BULLETIN (New Series) OF THE AMERICAN MATHEMATICAL SOCIETY Volume 43, Number 1, Pages 89–91 SArticle electronically published on November 22, 2005

DocID: 1tq1K - View Document