Toggle navigation
PDFSEARCH.IO
Document Search Engine - browse more than 18 million documents
Sign up
Sign in
<--- Back to Details
First Page
Document Content
Date: 2017-06-24 17:37:40
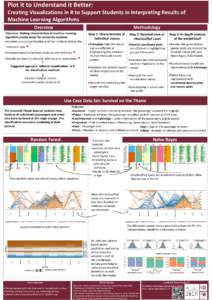
Plot it to Understand it Better: Creating Visualizations in R to Support Students in Interpreting Results of Machine Learning Algorithms Overview Methodology
Add to Reading List
Source URL: www.user2017.brussels
Download Document from Source Website
File Size: 939,80 KB
Share Document on Facebook
Similar Documents
 Plot it to Understand it Better: Creating Visualizations in R to Support Students in Interpreting Results of Machine Learning Algorithms Overview Methodology